Reports & Spreadsheets
The main advantage of ProEPOS over a standard till is that it can produce detailed reports on your business activity. Providing you have:
- set up the stock database correctly
- process all customer transactions correctly through the POS terminal
- process all stock receives and returns / transfers accurately
You will find that the reports which the software can produce will help you run and improve your business.
There are five main types of report which ProEPOS can produce:
- Sales reports
- Transaction reports
- Stock reports
- Financial reports
- Customer reports
Most reports can be run for a given range of one or more days and filtered by department, supplier, employee and/or store. These are specified before the report is run.
All reports generated by ProEPOS can be printed to any Windows printer using standard A4 paper or exported into a spreadsheet to allow any customisation.
Reports are run from the Reports facility (the "Reports & Spreadsheets" option from the Main menu). The system will first display a dashboard of charts, subject to the dashboard not being disabled in the configuration, which by default displays department performance, employee performance, supplier performance and, for multi-site estates, store performance:
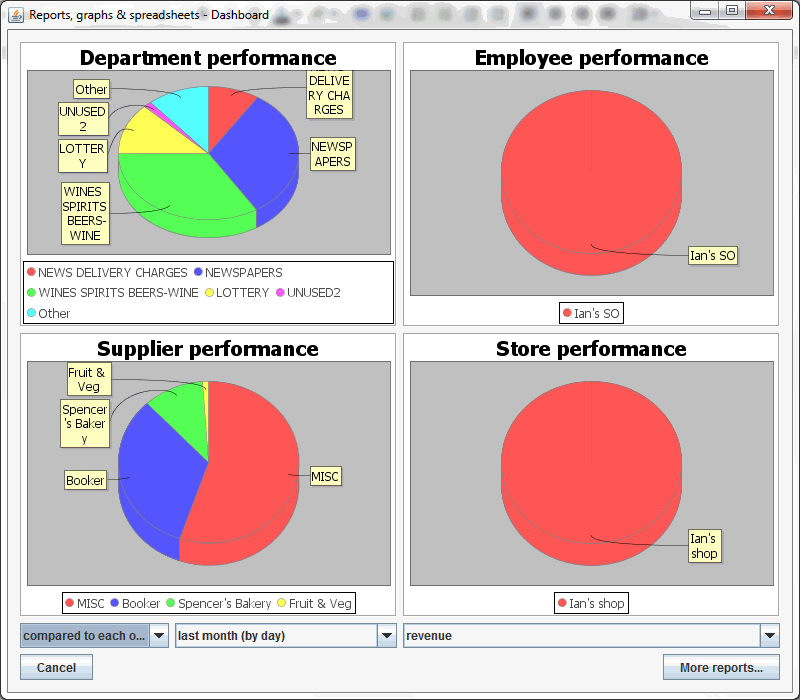
There are three dropdown menus that can be used to change what the dashboard is displaying; how to compare the different values, what to chart and for what period of time to chart. Any changes to these options will update the charts immediately. Details of the options are below:
The comparison gives you two options to choose from:
- Compared to each other - displays the pie charts, as shown above, showing the comparison between the different departments, suppliers, employees and stores.
- Over time - produces a line graph for each, as shown below, showing the different departments, suppliers, employees and stores over the chosen period of time.
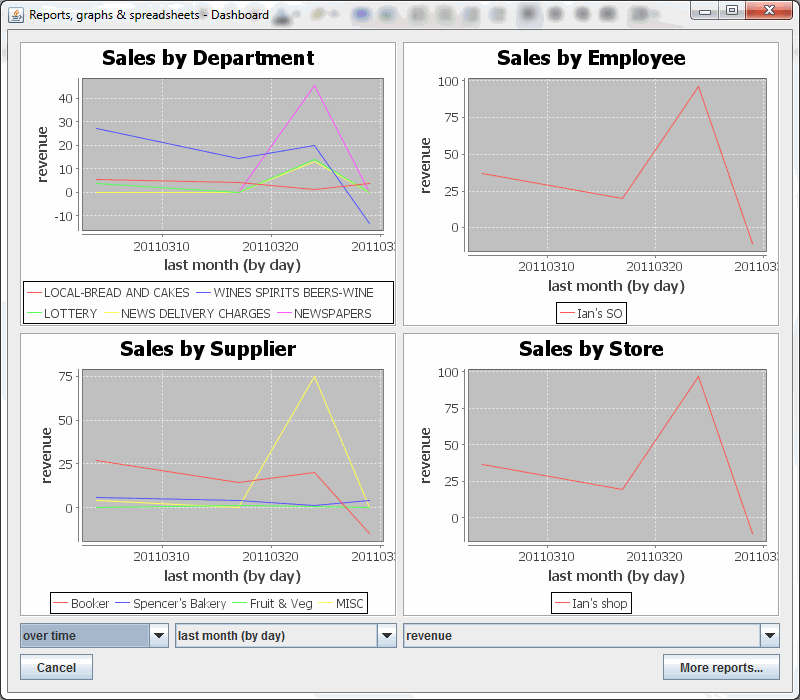
What to chart gives you three options to choose from:
- Revenue - revenue generated
- Margin - margin / profit made on sales
- Units - number of units sold
The period gives you thirteen options to choose from:
- Today (by hour)
- Yesterday (by hour)
- This week (by day)
- Last week (by day)
- This month (by day)
- Last month (by day)
- This year (by month)
- This year (by week)
- Last year (by month)
- Last year (by week)
- All time (by year)
- All time (by month)
- All time (by week)
By clicking on a chart the system opens up the underlying report showing the figures the chart is based on:
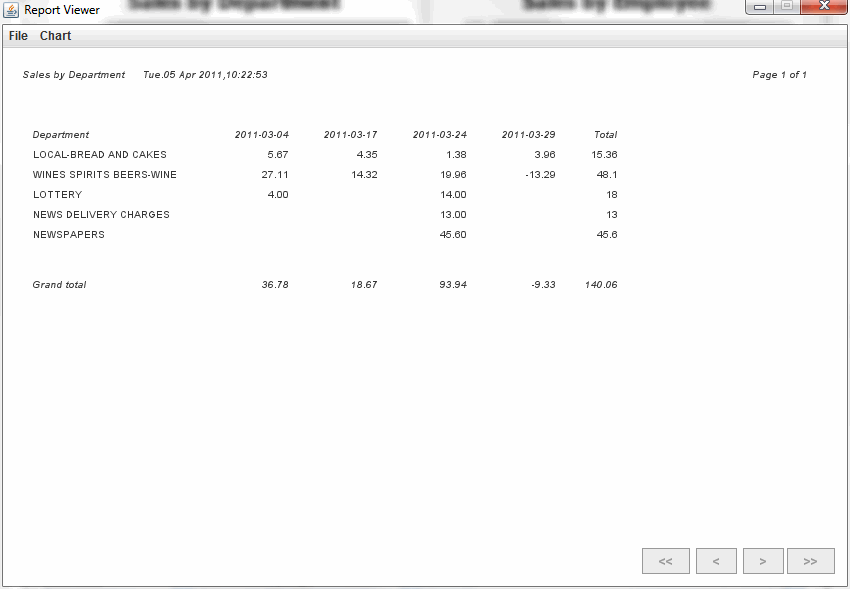
To generate your own report, click on the MORE REPORTS button to open the "Report Runner" window:
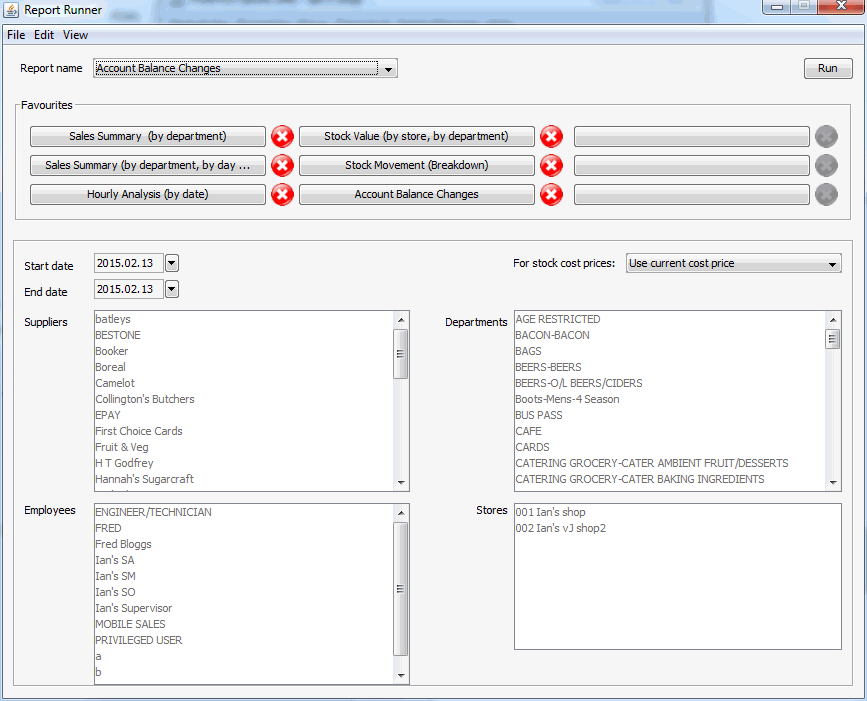
Select the required report from the report list, it is possible to select up to 9 reports to be your favourite reports for quick access in place of searching through the list. To add a report as a favourite select the report from the list and click a blank button.
Having chosen the report you want specify any filtering options you require (any filtering options that are not available for the report will be disabled and greyed out). The filtering options available are:
Start date- start date for the report (default is today's date)
End date- end date for the report (default is today's date)
For stock cost price- this allows you to select a relevant method for how you want to view the costs of items (default is Use current cost price)
Suppliers- select specific supplier(s) (default is all)
Employees- select specific employee(s) (default is all)
Departments- select specific department(s) (default is all)
Stores- select specific store(s) (default is all)
When you have specified the filtering options, click the Run button. The report will be created and opened in the report viewer:
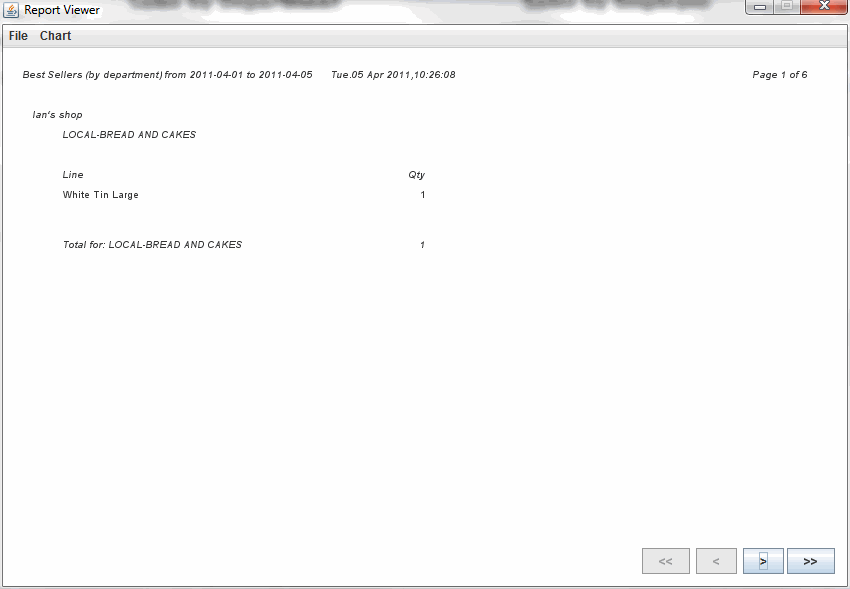
If the report has multiple pages the page buttons are activated. Use these to move forwards and backwards through the report:

To print a report, select the "Print" option from the "File" menu in the "Report Viewer" window, this will open a standard Windows print dialog allowing you to select the printer, etc.
To export a report into a spreadsheet, select the "Export to spreadsheet" option from the "File" menu in the "Report Viewer" window, this will open a your spreadsheet file in your application (Excel or OpenOffice Calc).